.png)
Your company’s financial statements might look healthy. Revenue is growing, and the overall gross margin seems solid. But hidden beneath those top-line numbers, a dangerous story could be unfolding. High-margin, high-volume products can easily mask the poor performance of others, creating economic blind spots. A single SKU with high return rates or volatile shipping costs could be silently draining your cash, and you’d never know it by looking at averages. To get a true picture of profitability, you have to move beyond blended data and analyze performance product by product. This is the central idea behind SKU-level economics: a framework for uncovering the real financial contribution of every item you sell.
In the early days of a consumer business, calculating average-unit economics feels sufficient. You sell only a handful of products through one or two channels, sourced from a small number of suppliers. Costs are relatively stable. Margins are easy to explain. An average cost per unit and an average margin tell a story that feels close enough to reality. But as the business grows, “average” breaks down. New SKUs are added to expand assortments. Production moves across suppliers and geographies. Freight rates fluctuate. Inventory is received, sold, returned, and written down at different times and at different costs. This is the point when average-unit economics stop being a useful approximation and become actively misleading.
The problem is that “average cost” assumes every unit behaves the same. In reality, each SKU carries its own cost structure, supplier mix, freight profile, channel mix, and return dynamics. A domestically produced, high-volume staple behaves nothing like an imported seasonal item with volatile freight and promotional discounting. Even the same SKU can have materially different economics depending on when it was produced, how it was shipped, where it was sold, and which channel it moved through. When these differences are blended into averages, the signal disappears, resulting in an all-too-familiar set of economic blind spots for consumer businesses operating at scale:
- SKUs quietly drift from profitable to unprofitable without triggering any visible alarm
- Margins look healthy in aggregate, but erode at the product level
- Pricing, replenishment, and promotion decisions are made on distorted data
- Finance and operations spend more time reconciling numbers than acting on them
The problem isn’t that teams lack data. Quite the opposite. It’s that a dependence on averages to make sense of their data collapses complexity into something that feels manageable, but no longer reflects how the business actually works.
As soon as inventory, costs, and revenue start behaving differently across SKUs, channels, and time, average-unit economics stop answering the most important question: Which products are creating value, and which are destroying it?
That’s where the limits of averages become impossible to ignore, and where the need for SKU-level economics begins. Let’s dive in.
What are SKU-level economics?
At its core, SKU-level economics is a way to understand a business's true financial performance, one product, unit, and event at a time. Instead of asking, “What is our average margin?”, SKU-level economics asks more precise, and more actionable, questions:
- What does this SKU actually cost to produce and deliver?
- How do its margins change across channels?
- How do costs vary over time as suppliers, freight, and tariffs change?
- Which products generate profit, and which only appear to?
In a physical goods business, these questions are not academic. They determine pricing, purchasing, assortment strategy, and cash flow.
And they cannot be answered accurately with averages.
SKU-level economics treats the SKU as the atomic unit of the business: The point where inventory, cost, revenue, and accounting meet. Every receipt, shipment, return, adjustment, and cost change updates the economic reality of that SKU. Financials are not summarized first and analyzed later; they emerge directly from product-level activity.
What is a stock keeping unit (SKU)?
A stock keeping unit, or SKU, is a unique alphanumeric code assigned to a specific product to track it for inventory purposes. Think of it as a product’s internal ID card. While a customer sees a “Small, Blue T-Shirt,” your internal systems see something like “TSH-BL-S.” This code allows you to differentiate between product variations—like size, color, or material—and track the exact quantity of each you have on hand. SKUs are the foundation of effective inventory management, helping you automate reordering, analyze sales trends by specific item, and understand which products are your top performers. For a physical goods business, the SKU isn't just an operational tool; it's the central point where every cost, sale, and movement is recorded, making it the essential building block for understanding true profitability.
The difference between SKUs and UPCs
It’s easy to confuse SKUs with Universal Product Codes (UPCs), but they serve very different purposes. The key difference is internal versus external use. A SKU is created by you, for your business. It’s unique to your company’s inventory system and tailored to how you categorize products. Two different retailers selling the exact same blue t-shirt will have two different SKUs for it. A UPC, on the other hand, is a standardized, 12-digit code used universally. It’s the scannable barcode you see on most retail products, and it remains the same for that specific product no matter who sells it. The GS1 organization issues UPCs to manufacturers to identify a product, while you create SKUs to manage it within your own four walls.
Best practices for creating SKUs
A logical SKU architecture is the bedrock of accurate inventory data, which is exactly what platforms like Mandrel use to deliver real-time financial insights. Getting your SKU format right from the start will save you countless headaches. First, make every SKU unique; a blue t-shirt in size small needs a different SKU than the same shirt in medium. Never reuse SKUs from discontinued products. Second, establish a simple, consistent format. Start with a top-level identifier, like a category or supplier, and add more specific attributes. For example, WW-SBC-08 could stand for Women's Wear (WW), Shoulder Bag, Canvas (SBC), in size 8 (08). Finally, stick to letters and numbers, and avoid using spaces, special characters, or numbers that can be confused with letters (like 0 and O). This ensures your system—and your team—can always read them correctly.
Listen to the BlueOcean podcast on the future of AI-powered inventory management
How to calculate true SKU-level profitability
Shifting from average-unit economics to SKU-level economics requires a detailed approach to cost tracking. True profitability isn’t just revenue minus the factory cost of a product. It’s a comprehensive calculation that accounts for every expense incurred on a product’s journey, from the supplier’s dock to the customer’s doorstep and, sometimes, back again. To get an accurate picture, you have to identify and allocate all the direct and indirect costs associated with each specific SKU. This granular view is the only way to see which products are truly driving your business forward and which ones are quietly draining your resources. It’s about moving beyond approximations and getting to the financial truth of your inventory.
Track all associated costs
To understand how much profit each product generates, you need to track all the costs related to it. Many of these expenses are often bundled into overhead or spread across all products as an average, which hides the true performance of individual SKUs. Hidden costs like payment processing fees, shipping materials, and return processing can significantly eat into your margins. By breaking down and assigning each of these costs to the specific product that incurred them, you can build a precise and actionable profitability analysis for every item you sell.
Cost of goods sold (COGS)
This is the most direct cost associated with your products, but it’s crucial to get it right at the SKU level. COGS includes the purchase price from your supplier plus any other direct costs required to get the inventory to your warehouse, such as freight, import duties, and customs fees. Because these costs can fluctuate based on supplier, order volume, and shipping method, tracking COGS for each batch of inventory is essential for accuracy. An average COGS can mask rising costs on a key product line until it’s too late.
Platform and payment fees
Every transaction comes with fees that chip away at your revenue. These include marketplace commissions from channels like Amazon, which can be substantial, as well as payment processing fees from providers like Stripe or PayPal. These fees are often a percentage of the total sale value, so they vary with every order. Allocating these exact transaction fees back to the specific SKUs in the order is the only way to understand the real net revenue you’re receiving for each product sold.
Shipping and handling
Shipping and handling costs are more than just the carrier fees. This category includes expenses for packaging materials like boxes and filler, as well as the labor costs for picking and packing orders. These costs can differ dramatically between a small, lightweight item and a large, heavy one. Averaging these expenses can make your small items seem less profitable than they are, while hiding the fact that you might be losing money shipping your bulkier products.
Cost of returns
Returns are a significant and often underestimated expense. The cost of a return isn't just the refunded sale price; it includes the cost of return shipping, the labor to process and restock the item, and the potential loss of value if the product is damaged or can no longer be sold as new. You also lose the non-refundable transaction and platform fees from the original sale. Tracking these costs per SKU helps you identify products with high return rates that may have quality or description issues.
Advertising spend
To understand the true return on your marketing efforts, you must attribute advertising spend to the products it promotes. Whether you're running Google Shopping ads, social media campaigns, or sponsored listings on a marketplace, connecting that spend to the sales of specific SKUs is critical. This allows you to calculate a more accurate customer acquisition cost (CAC) and post-advertising gross profit for each product, revealing which marketing campaigns are actually profitable and for which items.
Use the right metrics and benchmarks
Once you’re tracking all associated costs, you can start using metrics that reflect your true profitability. This is where the SKU becomes the "atomic unit" of your business—the central point where inventory, costs, revenue, and accounting all meet. As we've explored before, every single event, from receiving a shipment to processing a return, updates the economic reality of that SKU. This approach moves you away from blended averages and toward transaction-level accuracy, which is the foundation for reliable financial reporting and smarter operational decisions.
A powerful metric for this is Post-Advertising Gross Profit (PAGP), which shows you the real profit generated by a product after subtracting COGS, platform fees, shipping, returns, and advertising costs. With this level of clarity, you can confidently decide which products to promote, which to reprice, and which to discontinue. An AI-native ERP like Mandrel is designed around this principle, automating landed cost allocation and financial workflows to give you real-time, SKU-level visibility into your true costs and margins without the manual spreadsheet work.
Putting SKU-level economics into practice
SKU-level economics becomes far more tangible when you see it applied to a real business. Rather than discussing theory, let’s walk through a simplified example and examine how its economics look through two different lenses: blended averages and SKU-level reality.
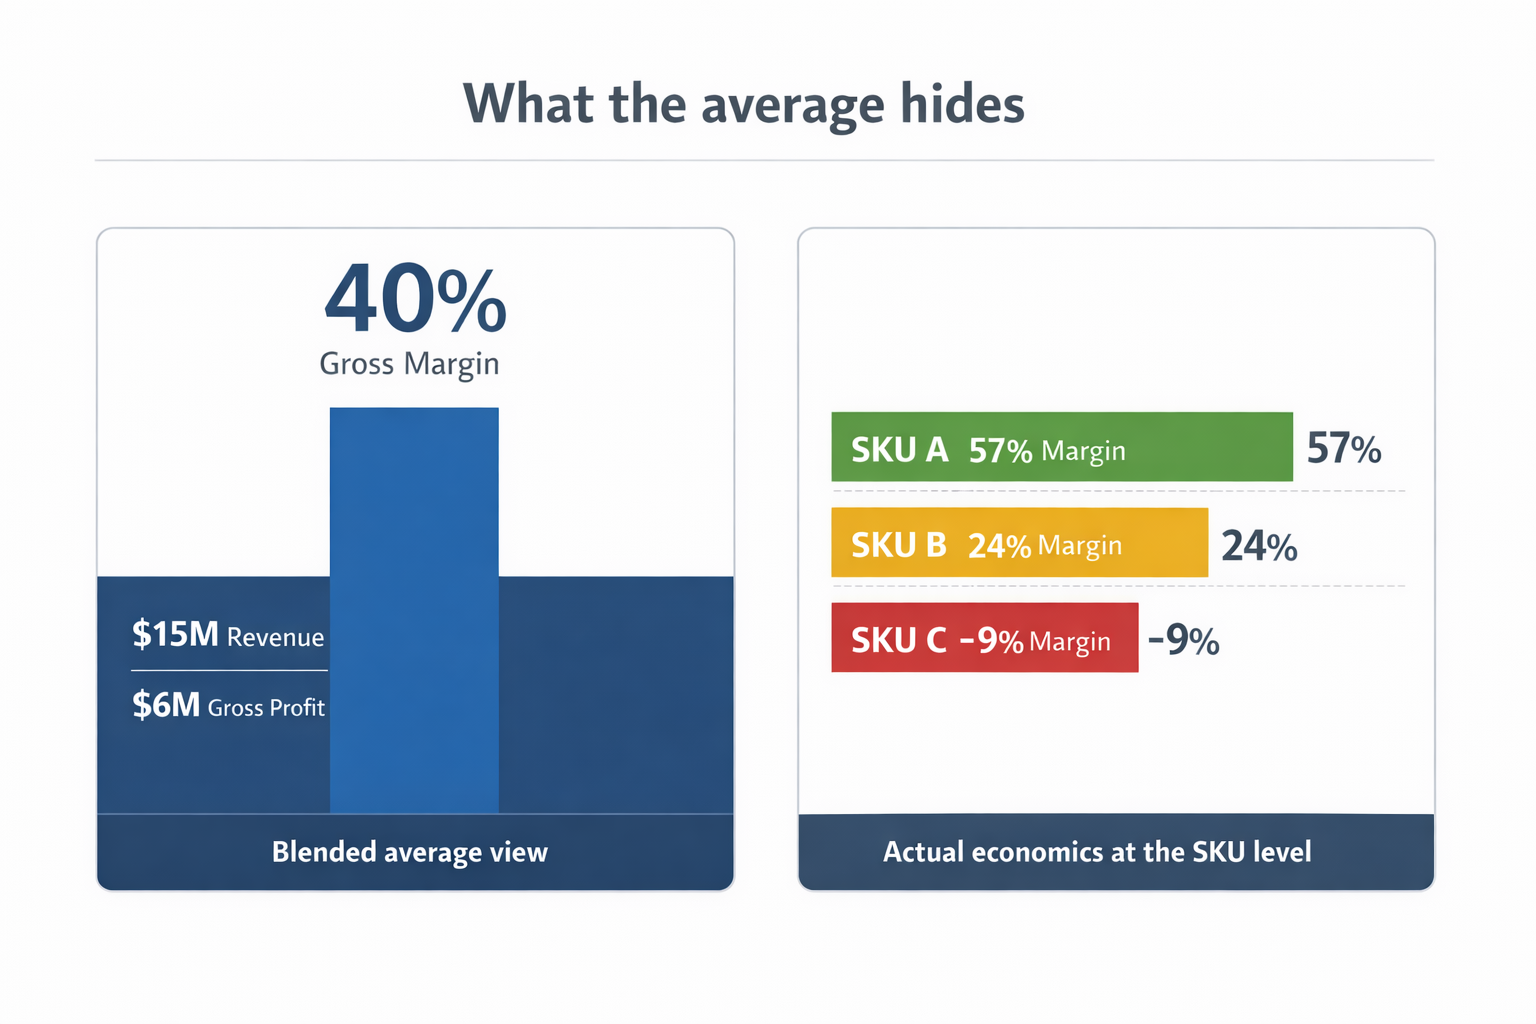
Imagine a DTC business doing $15M in annual revenue with three SKUs. From the outside, the business appears healthy and growing. A breakdown using a traditional, average-based approach would show:
- Average selling price: ~$30
- Average unit cost: ~$18
- Gross margin: 40%
- Gross profit: ~$6M
On paper, there’s no obvious problem. This is the view leadership sees when the business is run on average unit economics. But those averages are masking very different (and very consequential) realities at the product level.
Let’s go through each SKU individually:
SKU A is the backbone of the business. It generates $8 million in revenue on roughly 285,000 units sold, with a stable cost structure and minimal returns. At the unit level, it costs about $12 to produce and deliver, yielding margins close to 57%. SKU A alone contributes more than $4.5 million in gross profit, over three-quarters of the company’s total profit! This is the product that actually funds growth.
SKU B tells a more mixed story. It brings in $4.5 million in revenue across 145,000 units. Its margins average around 24%, generating a gross profit of just over $1 million. But those averages hide meaningful volatility. SKU B’s costs fluctuate based on freight timing and shipment structure, making its profitability inconsistent from month to month. It isn’t broken, but it’s far less reliable than the top-line numbers suggest.
Then there’s SKU C. SKU C looks attractive in aggregate reporting. It’s a premium product with a higher price point, generating $2.5 million in revenue on 70,000 units sold. In average-unit economics, it boosts the company’s overall selling price and appears to improve product mix.
 In reality, SKU C is destroying value.
Once returns, fulfillment costs, platform fees, markdowns, and write-offs are accounted for, SKU C costs roughly $39 per unit to sell against an average selling price of $35.70. The result is a negative margin of nearly 9%. Over the course of the year, SKU C loses approximately $630,000 in gross profit.
Every additional unit sold of SKU C makes the business worse.
None of this, however, is visible in the blended view. The business still reports 40% gross margins. Total gross profit still reconciles. SKU A’s strength quietly subsidizes SKU C’s losses, allowing the averages to look healthy while capital, attention, and inventory are tied up in a product that should not exist in its current form.
This is the fundamental failure of average-unit economics in a multi-SKU, multi-channel business. The numbers reconcile perfectly while obscuring the most important truth: not all revenue is created equal, and some growth is actively harmful.
SKU-level economics exposes that reality. It shows exactly which products generate profit, which are marginal, and which are silently eroding the business.
For a $15 million DTC company trying to scale efficiently, that difference isn’t a nice-to-have: it’s the difference between compounding success and compounding mistakes.
Develop smart pricing strategies
When you only look at average costs, your pricing is based on a guess. SKU-level economics replaces that guesswork with precision. By understanding the true, fully-landed cost of each specific product—including freight, tariffs, and channel-specific fees—you can build pricing strategies that protect your margins on every single sale. This detailed view allows you to ask more strategic questions: How do this SKU’s margins change when sold through retail versus direct-to-consumer? How should we adjust pricing to account for a recent spike in shipping costs? This level of insight lets you move from a one-size-fits-all approach to a dynamic pricing model that reflects the unique economic reality of each product you sell.
Optimize your inventory and product mix
Not all SKUs are created equal. As we saw in the example earlier, some products (like SKU A) are the quiet heroes funding your growth, while others (like SKU C) are secretly draining your cash. SKU-level data makes this distinction crystal clear. It empowers you to make smarter decisions about your product assortment and inventory management. You can confidently double down on your most profitable items, re-evaluate the pricing or sourcing of marginal products, and strategically discontinue the ones that are holding you back. This ensures your capital isn't tied up in underperforming stock and that your warehouse space is dedicated to products that actually contribute to your bottom line.
Allocate your marketing budget effectively
Effective marketing isn't just about driving revenue; it's about driving profitable revenue. When you know which products have the healthiest margins, you can stop wasting resources on items that are draining your cash. Instead of applying a blanket marketing strategy, you can focus your ad spend on promoting your true money-makers. Imagine creating targeted campaigns specifically for your highest-margin SKUs or directing your budget toward the channels where those products perform best. This data-driven approach ensures your marketing dollars are working as hard as possible to grow your business profitably, improving your return on ad spend (ROAS) and overall financial health.
The broader business benefits of SKU-level data
The shift to SKU-level economics does more than just clean up your financial reports; it creates a ripple effect of clarity across your entire organization. When your business operates from a single source of truth centered on the SKU, every department—from finance and operations to marketing and merchandising—is aligned. Decisions are no longer made in silos based on conflicting or incomplete data. Instead, everyone is working with the same accurate, real-time information about what’s truly driving the business. This shared understanding is foundational for scaling efficiently. An AI-native ERP like Mandrel is built to provide this unified view, turning SKU-level data into the operational backbone of your company and ensuring every team can act with confidence.
Improve customer service and operations
Focusing only on top-line revenue can be misleading, but focusing on the profit you keep from each transaction tells the real story. SKU-level data directly impacts your operational efficiency and, by extension, your customer experience. With a precise, real-time view of inventory, you can prevent costly stockouts and frustrating backorders, leading to happier customers. Operationally, this clarity streamlines everything from purchasing and receiving to fulfillment, reducing errors and cutting down on expensive expedited shipping. By improving your operations, you lower your costs and increase the profit you retain from every sale, creating a more resilient and customer-centric business that our customers consistently build.
Why is tracking SKU-level economics so hard?
By the time a business realizes it needs SKU-level economics, it has usually outgrown the systems it relies on to understand performance. The challenge isn’t a lack of data. It’s structural. SKU-level economics requires inventory, cost, revenue, and accounting to stay aligned in real time. Most systems were never designed to do that.
In practice, businesses face five structural barriers:
- Inventory and finance live in separate systems: Inventory systems track units. Accounting systems track dollars. Each is internally consistent, but they operate on different clocks and different definitions of truth. SKU-level economics requires those two views to agree continuously, not just reconcile at month-end.
- Costs are finalized after inventory moves: Freight invoices arrive weeks later. Duties and tariffs change mid-shipment. Vendor invoices are corrected after the fact. Inventory is often sold before its true cost is known, turning SKU-level economics into a reconstruction exercise rather than a live view.
- Traditional ERPs are period-based, not event-based: Most ERPs summarize activity at month-end and allocate costs in batches. That works for financial statements. It doesn’t work for operational decision-making. By the time economics are visible, pricing, purchasing, and promotion decisions have already been made.
- Averages erase granularity: Landed costs are averaged across shipments. Margins are averaged across product lines. COGS is averaged across periods. These simplifications make reporting easier but destroy the SKU-level signal.
- Dashboards can’t fix broken foundations: Analytics tools can visualize data, but they can’t correct structural misalignment. If inventory, cost, and revenue aren’t connected at the system level, dashboards simply surface inconsistencies rather than solve them.
The result is predictable: teams default to reconciliation. Finance reconciles inventory to the general ledger. Operations explains variances. Adjustments are made at close. SKU-level economics becomes manual, retrospective, and fragile.
At its core, the problem is architectural. Few systems were designed with the SKU as the atomic unit of the business. They optimize around orders, accounts, warehouses, or accounting periods, not around the continuous economic reality of each product.
SKU-level economics requires a foundation where inventory movement, cost flow, revenue recognition, and accounting logic converge at the item level in real time. That foundation rarely exists in traditional systems.
A simpler way to manage SKU-level economics
We built Mandrel because SKU-level economics shouldn’t require spreadsheets, retroactive allocations, and month-end reconciliation. Inventory-driven businesses deserve systems where financial truth emerges directly from operational activity.
Mandrel was designed around a different foundation:
✓ Inventory automation at the source: Documents, purchase orders, and shipping events are captured automatically, eliminating manual data entry and reducing reconciliation work.
✓ Real-time SKU-level costing: Every inventory movement updates unit costs, landed costs, and margin at the item level as it happens.
✓ Continuous alignment between operations and finance: Inventory quantities, COGS, and accounting logic stay synchronized by default, not reconciled after the fact.
✓A single unified platform: Inbound inventory, outbound fulfillment, costing, and financial visibility live in one system, reducing system sprawl and duplicated work.
The result is not another reporting layer. It’s operational clarity. SKU-level economics becomes native to how the business runs, enabling faster pricing decisions, more disciplined purchasing, and scalable growth without scaling headcount.
Schedule a demo with an inventory expert to see how Mandrel makes SKU-level economics operational.
Related articles
- Inventory Management System for Small Business: 2026 Guide
- Landed Costs: Not Just Another Financial Metric
- Turn POs into Profits: Strategies for Optimizing Purchase Orders
- Navigating The Impact of Tariffs on Margins
Frequently Asked Questions
When should a business switch from average-unit economics to SKU-level economics? The switch is less about hitting a certain revenue milestone and more about managing complexity. The moment you start adding new products, sourcing from different suppliers, or selling across multiple channels, your "average" cost starts to become a fiction. If you can no longer explain with certainty why your margins fluctuate month to month, it’s a clear sign that you need a more granular view of your product performance.
My overall gross margin looks healthy. Why do I need to dig deeper into individual SKUs? A healthy overall margin can be dangerously misleading. It’s often propped up by a few high-performing products that are masking the losses from others. Without a SKU-level view, you might be investing your cash and marketing budget into items that are actually draining your profits. Digging deeper allows you to see which products are your true growth engines and which are just along for the ride, or worse, actively hurting your bottom line.
What's the most overlooked cost when calculating SKU profitability? The cost of returns is almost always underestimated. It’s not just the money you refund to the customer. You also have to account for return shipping fees, the labor required to inspect and restock the item, and the potential loss if the product can no longer be sold as new. These expenses can quickly turn a seemingly profitable SKU into a financial liability, especially for items with fit or quality issues.
Can't I just track SKU profitability with spreadsheets? While you can certainly try, spreadsheets often create more problems than they solve. They are manual, prone to error, and become outdated almost immediately. The real challenge is keeping your inventory data, landed costs, and sales information perfectly synchronized in real time. Spreadsheets require constant reconciliation, meaning you spend your time managing data instead of making decisions with it.
How does SKU-level data help with more than just pricing? Getting your pricing right is a huge benefit, but it's really just the beginning. This level of clarity transforms your entire business. It shows your marketing team which products to feature in campaigns to drive profitable growth. It gives your operations team the confidence to double down on top performers and discontinue the ones that are underperforming. It aligns every department around a single source of truth, which is the foundation for scaling efficiently.
Key Takeaways
- Look beyond blended averages: Your overall gross margin can be deceptive, as profitable "hero" products often mask the losses from underperforming SKUs. To get a true financial picture, you must analyze profitability product by product.
- Account for every cost per SKU: True profitability requires tracking all expenses beyond the initial purchase price. Assign every related cost, including shipping, returns, and marketing fees, to the specific product to understand its actual financial contribution.
- Connect operations with finance for real-time clarity: Traditional systems create a disconnect between inventory data and financial reporting, leading to manual, after-the-fact analysis. A unified, SKU-centric platform provides a single source of truth, turning daily operational events into immediate financial insights.

.png)
